Google Analytics is one of the most widely used website analytics tools, but it is not always the easiest way for organisations to understand what is happening on their website. At Square Eye, we typically recommend Looker Studio to clients as the reporting layer, using it to present Google Analytics data in clear, tailored dashboards that focus on the metrics that matter most.
Here’s why.
Google Analytics is powerful, but it is easy to get lost
Google Analytics contains a huge amount of data. For specialists, that depth is invaluable, but for most teams it can feel overwhelming.
It is easy to end up clicking through endless menus and charts, unsure what you are supposed to be looking at or what the numbers actually mean.
In practice, most clients do not need everything. They need the right things. What pages are performing well, where visitors are coming from, which content people are engaging with, and what is improving month to month.
Looker Studio allows us to extract those key insights and present them clearly, without the noise.
Reports built around your priorities, not generic dashboards
One of the biggest advantages of Looker Studio is that the report can be built around your specific goals rather than a standard, one size fits all analytics view.
That might mean focusing on key service pages, team or profile pages, blog or resources content, search traffic performance, or how users move through the site.
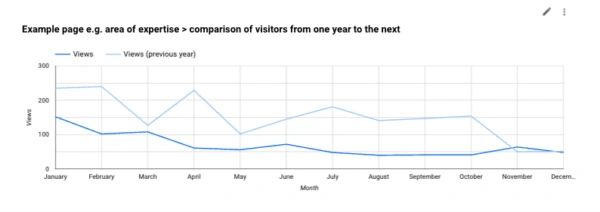
Example area of expertise page year on year comparison of page visits
Instead of handing over Google Analytics and expecting you to interpret it, we design a dashboard that highlights what actually matters to your organisation.
Clear visuals that work for stakeholders and boards
Analytics is not just about data, it is about communication.
Once your Looker Studio dashboard is set up, individual charts and tables can be copied directly from the report and dropped straight into board papers, management reports, or internal presentations. There is no need to recreate graphs manually or double check figures across different tools. You are using a consistent, live source of truth that has already been structured and explained.
This makes Looker Studio particularly useful when analytics needs to be shared beyond marketing teams, for example, with senior leadership, committees, or external stakeholders.
Automated PDFs, plus live access when you need it
Looker Studio works very well for regular reporting.
We can set the report up so that a PDF snapshot is emailed directly to your inbox as frequently as you like. Most clients opt for a monthly report, but weekly or quarterly summaries are just as easy to arrange.
The PDF is only the surface layer. You can still access the live dashboard at any time to change date ranges, filter by device or location, and explore trends in more detail.
If you need the raw data for further analysis, you can also download CSV files for different time periods directly from the dashboard without needing to log into Google Analytics at all.
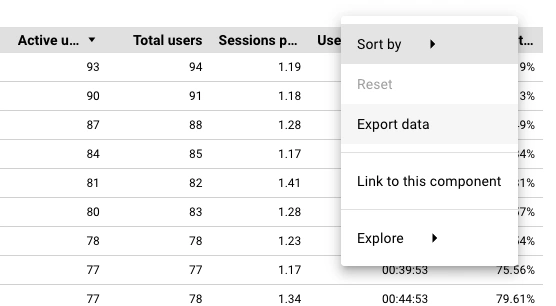
Exporting data from the Looker Studio dashboard controls
Bringing multiple data sources into one clear report
Another major benefit of Looker Studio is its ability to pull data from multiple platforms into a single report. As well as Google Analytics, we can connect tools such as Google Search Console, SE Ranking, Google Sheets and many other third-party platforms, allowing search performance, rankings, and on-site behaviour to be viewed side by side. This removes the need to jump between different tools and spreadsheets and makes it much easier to see how different strands of activity relate to each other. Looker Studio supports a wide range of native and partner integrations, which you can explore here: https://lookerstudio.google.com/data-sources
Interactive reporting without the risk of breaking anything
Unlike static reports, Looker Studio dashboards are interactive.
You can explore the data, answer ad hoc questions, and dig a little deeper without worrying about changing settings or disrupting the core report. It is a much more confident way to engage with analytics, especially for teams who do not want to spend time learning the Google Analytics interface.
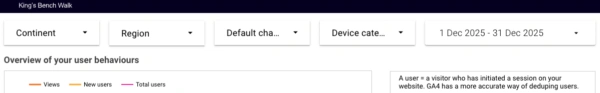
Looker Studio report controls & filters
Structured reporting, with flexibility when you want it
To keep reports consistent and reliable, we do not usually offer shared editorial control over the main Looker Studio dashboard we create for clients. In our experience, once multiple people start editing layouts or filters, it can become time-consuming to unpick changes and ensure the data is still being interpreted as intended.
If you would like a version to experiment with, we are very happy to provide a copy of the dashboard we create for you. This allows you to build on it, test ideas, or explore additional views, while keeping the core reporting version clean, stable, and easy to trust.
Google Analytics still matters, it just sits in the background
We are not replacing Google Analytics. It remains the engine underneath everything we do.
The difference is how the data is surfaced. Looker Studio is the dashboard you will actually use. Google Analytics is the deep detail we can access when needed.
Together, they give you clarity without losing power.
Better reporting leads to better decisions
Analytics should help you answer practical questions. What content should you invest more time in? Which pages need improving or simplifying? What is attracting traffic but not delivering results? Where should you focus next quarter? Which AI search engines or social media platforms should we focus on?
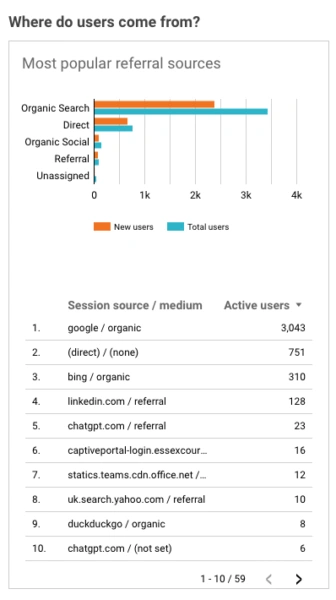
Graph & table showing where site visitors come from
By turning complex analytics into a clear, focused reporting tool, Looker Studio helps move analytics from interesting data to useful insight.
⸻
Next steps
If you already have Google Analytics set up but are finding it hard to get clear insight from the data, a Looker Studio dashboard can be a good next step. We can review your current analytics setup, recommend the most useful metrics for your organisation, and design a reporting dashboard that reflects how you actually use your website. Send us an email at [email protected].